Among the Power Pitchers: Does Kansas City’s Contact-Heavy Approach Give the Royals a Postseason Edge?


Grantland
October 20, 2015
by Ben Lindbergh
It’s a hard life for hitters on these postseason streets. The weather is windy and cold, so the ball doesn’t carry and bad contact hurts the hands. Players’ heads are hidden by baseballaclavas, and fans double-fist baseball gloves, as much for warmth as to improve their odds of snagging a souvenir. If the Mets make it to November, Yoenis Cespedes might slaughter a tauntaun to stay warm during mound meetings.
To make matters worse, as the temperature has dropped, the heat has been turned up in the batter’s box. You’ve seen the flames licking at chyrons as yet another 95 mph pitch crosses home plate, and you’ve heard broadcasters marvel at the nasty stuff on display. And while you can’t believe everything you hear on October broadcasts, there’s no doubt that we’ve seen something special, velocity-wise. This postseason’s pitchers are throwing harder than ever before.
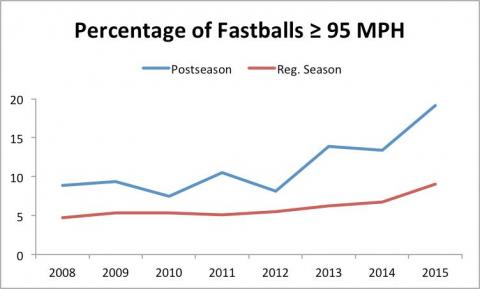
The graph [above] shows the percentage of fastballs (To be more specific, pitches classified as four-seamers, two-seamers, or sinkers by MLB Advanced Media.) clocked at 95 mph or faster in the regular season and postseason from 2008 to 2015.
Pitches have always been faster in the postseason, for several reasons: Pitchers who throw hard tend to be better, which means that harder-throwing teams are more likely to make the playoffs and harder-throwing pitchers are more likely to grab a big share of the October innings. Couple that with low average velos in April and May and pitchers’ extra incentive to max out during the postseason’s pressure-packed moments, and you have a recipe for some separation between those red and blue lines.
Velocity has climbed leaguewide throughout the years for which we have PITCHf/x data, but the uptick this October is startling. Three years ago, one in 12 playoff heaters went 95 mph or faster. This year, we’re up to almost one in five. And if anything, that percentage is likely to increase: The teams with the postseason’s slowest-throwing staffs (the Astros by far, followed by the Dodgers) have been eliminated, while the ones with the most flamethrowers (the Mets and Royals) are still tugging the average radar reading upward.
Not only are aces overrepresented in the playoffs, but they’re also deployed in sadistic ways. Mets rookie Noah Syndergaard sits at 97-plus as a starter, but in an inning of work out of the bullpen in Game 5 of the NLDS against the Dodgers, he threw 12 of his 13 fastballs at 99 or 100. The Dodgers swung at seven of them and missed or fouled off six.
Even more mild-mannered midrotation starters have transformed into super-powered setup men. As a regular-season starter, Mets lefty Jon Niese’s four-seamer and sinker sat at 90.0 and 89.6, respectively. In two playoff relief outings, they’re up to 93.5 and 92.2. Royals lefty Danny Duffy’s four-seamer and sinker averaged 94.3 and 94.0 in the regular-season rotation. Out of the pen in the postseason, they’ve averaged 97.0 and 97.6. And in his playoff role as a reliever, Bartolo Colon’s four-seamer and sinker, which checked in at 91.1 and 88.1 for the first six months of the season, have leveled all the way up to … 91.1 and 88.4. OK, so not every arm has an extra gear.
The obvious question about playoff velocity — other than, “When should we prep the OR?” — is whether any type of hitter or team is better suited to this harsh October environment. Weighted by the number of postseason innings they’ve pitched, the pitchers who’ve appeared in these playoffs have struck out 23.2 percent of the regular-season batters they’ve faced, well above the leaguewide rate of 20.4 percent. Are all hitters equally screwed against power pitching, or do some benefit from a built-in resistance?
Baseball analyst Joe Sheehan often notes in his newsletter that since the sport’s strikeout rate spiked in 2009 (coinciding with an expansion in the size of the strike zone), contact teams have torn it up in October. The teams whose hitters had the higher regular-season contact rate have gone 32-14 in postseason series over that span, and that will rise to 34-14 if the Royals and Mets don’t relinquish their leads in the current round.
I’m skeptical that this is a real trend. Six-plus postseasons is a small sample, and it wouldn’t be hard to find other factors with random, misleading links to postseason success — teams with bigger-capacity ballparks, let’s say, or longer hair. Previous attempts to uncover the secret to postseason play haven’t worked outside of the samples that were used to produce them. And even if having a higher contact rate helped, it couldn’t be so significant that it would produce a .700 winning percentage.
Still, when you watch the Royals foul off two-strike pitches and string together singles-based five-run rallies off pitchers like David Price, then switch channels and see the strikeout-prone Cubs swinging through the Mets’ high-octane offerings, you might wonder whether contact makes K.C. unkillable. According to ESPN Stats & Info, the 2015 Royals — who also pulled off a series of memorable comebacks last year — are the first team since the 1996 Yankees to trail by multiple runs in four of their first five wins in a single postseason. Down seven runs heading into the ninth inning of their Game 3 loss on Monday, they scored enough to strike fear into Jays manager John Gibbons, who brought in his closer with an 11-6 lead. Maybe there’s more to their success than whether or not Alcides Escobar swings at the first pitch.
I asked Mitchel Lichtman, coauthor of The Book: Playing the Percentages in Baseball and a former Cardinals consultant, to investigate whether batters on either end of the contact spectrum have an advantage — or more accurately, less of a disadvantage — against the power pitching that’s so prevalent at this time of year. Lichtman defined power and finesse pitchers as those with strikeout rates in the top and bottom thirds of the league, respectively. He then classified contact and noncontact hitters as players whose combined walk and strikeout rates were in the top or bottom third. Finally, he dissected the stats to see how hitters of each type did against each group of pitchers from 2010 to 2015, using Weighted On-Base Average (wOBA), an all-in-one offensive rate stat on the same scale as OBP. For reference, the league-average wOBA over this period was .315. This table [above] contains the results:
Hitters of all types beat up on finesse pitchers and suffer against power pitchers, but contact hitters suffer slightly less. Overall, the typical noncontact hitter is a bit better than the typical contact hitter. But put a power pitcher on the mound, and the ranking reverses. All else being equal, hitters who put balls in play do better against bat-missers than hitters with whiff in their game. The Royals recorded a .292 wOBA against power pitchers this season, 10 points better than the .282 mark we would have expected based on their overall performance and the performance of the power pitchers they played.
We can put familiar faces to this phenomenon. Baseball-Reference defines finesse and power differently than Lichtman, but by B-Ref’s definition, Adam Dunn (the owner of a 28.6 percent career strikeout rate) posted a .791 OPS against power pitchers and a .920 OPS against finesse pitchers, a larger-than-average split. Meanwhile, author and ESPN analyst Doug Glanville, who posted an 11.7 percent K rate during his big league career, showed almost no power/finesse split: .691 OPS against power pitchers, .699 vs. finesse.
“I liked hitting power guys, because there was a lot less to think about,” Glanville says. “John Smoltz was a good example — go ahead, here you go, four-seamer. As he got older, he became more of a guy with multiple pitches and sidearm deliveries and all kinds of craziness. Personally I’d rather face the John Smoltz that was throwing 98, because it was like two pitches you had to worry about.”
Glanville notes that the vulnerabilities of low-contact hitters are easier to exploit, although their strengths often do more damage. “I would think a lot of the big power guys — and we’re not talking about [Albert] Pujols and guys who are just exceptional, like Vladimir Guerrero — they probably have more holes,” Glanville says. “Because to make contact on a lot of different kinds of pitches, you probably have less holes. I’m not saying you’re driving those pitches, but you can make contact. I think it’s a unique skill, to be able to put the ball in play.” It’s not clear why power pitching would accentuate the weaknesses of one group more than the other, but contact hitters’ better bat control could help them handle strikeout pitchers’ predominantly faster speeds. The Cubs, for instance, seem to struggle against good velocity.
It’s possible that the Royals’ institutional aversion to true outcomes helps them more in this high-strikeout era than it did in the past, although Lichtman says any era-specific effect would be “a very, very slight edge.” Theoretically, it should also matter more in October, when teams face a higher concentration of power pitchers. Glanville believes that contact might even have a compounding effect when paired with the postseason’s high stakes. “The postseason obviously is a different animal,” Glanville says. “It’s not just inherent contact. I think it’s the type of pressure your team places on the other team. In the postseason, when you’re already established as a good team, that point of differentiation I think really starts to matter.”
On the other hand, playoff teams tend to be better than average on defense, which would work against teams that excel with singles (and would work in favor of teams that hit homers). Although the maxim says “Good things happen when you put the ball in play,” most balls in play become outs. Luckily for the Royals — or maybe more than “luckily,” if Glanville is right — the Royals have run into uncharacteristic lapses by strong defensive teams. Double-play balls and popups have turned into baserunners and runs during Kansas City’s recent rallies, which Glanville says summarized what “contact can do when it’s at its best and it’s sort of a unified model.”
Relative to their league, the Royals might be the best contact team ever, which would make them the biggest beneficiaries of any October contact effect. But the Royals probably aren’t true October tardigrades, engineered to flourish in the sport’s most adverse offensive environment. The stats suggest that their contact tendencies give them only a small edge. “If the Royals lineup had a 10-point-less split than an average lineup [as they did from 2013 to 2015], and they played against power pitchers every game, they would have a five-point wOBA advantage,” Lichtman says. “That is around a 1.5 percent win expectancy per game. It’s not nothing, but it’s also not something you would ‘notice.’ It probably gives them an extra 2 percent or so to win a series.” In other words, it’s worth roughly half what home-field advantage (which they’ve also had in the ALCS) is worth — or even as much as home-field advantage, if their performance against power pitchers in 2015 alone reflected their true talent. That’s worth paying attention to, but it’s probably not a reason to pick them over a significantly superior opponent.
Nor is it likely that the Royals have built their team with the playoffs in mind. To the extent that the look of their lineup stems from a unified philosophy, it’s probably economically motivated: Because contact is less prized by modern teams than patience and power, it’s also less expensive. And given the physical skills of the players who tend to possess it, it might also be easier to pair with good defense, another commodity that the free-agent market has historically undervalued. In the most generous interpretation of their roster construction, the Royals’ old-school approach is actually innovation in disguise, a version of Moneyball built on the opposite strategy of the early-aughts A’s.
Given the choice, I’d happily take the big bats of Jose Bautista, Josh Donaldson, and Edwin Encarnacion over the Royals’ lower-slugging attack, in October or any other month (especially since the Blue Jays make contact more often than one would expect). But the Royals’ bats might not have to be better than the Blue Jays’. They might just have to be better than they were in 2014, when they that made it to Game 7 of the World Series. And by any measure imaginable, they are.
Republished from Grantland.com.
Photo #1 Credit: Tom Szczerbowski/Getty Images
Video content accessible at Grantland.com.


